Jump to page sections
Here I describe how I calculate the trend for financial products, indices/indexes, etc. It can really be used for any kind of numbers where you want a trend analysis. Incidentally, I originally wrote a version of this to calculate when computer disk storage space in an enterprise would reach 0 on various components/drives.
I use trend-line mathematical analysis of the numbers. This was written by Joakim Borger Svendsen, head of
Svendsen Tech.
Below are examples of analysis now during the tumultous and unusual times in March 2020, when Covid-19 is rampant, also known as the Corona virus.
The VIX fear index, measuring volatility (fluctuations in price), has skyrocketed recently and is at the highest since February 2009 right now on March 6, 2020.
NB! These are simply indicators and based on nothing but math and close rates, so make sure you're aware of that!
It will exaggerate the current trend.
The code I use is open source and published on
GitHub here.
I use financial data from Yahoo. The code works unaltered against it as per 2020-03-06.
Calculate the Trend for the SnP500 Index
Example analysis from March 6, 2020. SnP500 is closed now as I'm writing this at 10 PM / 22:00 GMT. Nasdaq is still kicking, apparently (see below).
PS C:\temp> Get-SnP500Trend -FilePath .\^GSPC.csv

# Close rates back in time.

Date       Rate        Count
----       ----        -----
2020-02-05 3334.689941     1
2020-02-06 3345.780029     2
2020-02-07 3327.709961     3
2020-02-10 3352.090088     4
2020-02-11 3357.750000     5
2020-02-12 3379.449951     6
2020-02-13 3373.939941     7
2020-02-14 3380.159912     8
2020-02-18 3370.290039     9
2020-02-19 3386.149902    10
2020-02-20 3373.229980    11
2020-02-21 3337.750000    12
2020-02-24 3225.889893    13
2020-02-25 3128.209961    14
2020-02-26 3116.389893    15
2020-02-27 2978.760010    16
2020-02-28 2954.219971    17
2020-03-02 3090.229980    18
2020-03-03 3003.370117    19
2020-03-04 3130.120117    20
2020-03-05 3023.939941    21

# Predictions ahead (-21 for each number for how many predictions ahead).

2020-03-06 3003,129475    22
2020-03-06 2982,264134    23
2020-03-06 2961,357041    24
2020-03-06 2940,417798    25
2020-03-06 2919,453528    26
2020-03-06 2898,469579    27
2020-03-06 2877,470011    28
2020-03-06 2856,457941    29
2020-03-06 2835,435783    30
2020-03-06 2814,405424    31
2020-03-06 2793,368352    32
2020-03-06 2772,325750    33
2020-03-06 2751,278564    34
2020-03-06 2730,227556    35
2020-03-06 2709,173346    36
2020-03-06 2688,116438    37
2020-03-06 2667,057247    38
2020-03-06 2645,996115    39
2020-03-06 2624,933325    40
2020-03-06 2603,869114    41
2020-03-06 2582,803680    42
Calculate the trend for the NASDAQ 100 Composite Index
Here's 50 samples back and 10 predictions ahead (exaggerated trend) for the NASDAQ 100 composite index as of 2020-03-06. The name of the function is misnomered in retrospect (damn retrospect), but I specify the "^NDX" paper, so it handles the NASDAQ data I download from
Yahoo here.
PS C:\temp> Get-SnP500Trend -FilePath .\^NDX.csv -SamplesBackCount 50 -PredictionsAheadCount 10 |
    select -Last 30

Date       Rate        Count
----       ----        -----
2020-02-06 9445.919922    31
2020-02-07 9401.099609    32
2020-02-10 9516.839844    33
2020-02-11 9517.860352    34
2020-02-12 9613.200195    35
2020-02-13 9595.700195    36
2020-02-14 9623.580078    37
2020-02-18 9629.799805    38
2020-02-19 9718.730469    39
2020-02-20 9627.830078    40
2020-02-21 9446.690430    41
2020-02-24 9079.629883    42
2020-02-25 8834.870117    43
2020-02-26 8873.759766    44
2020-02-27 8436.669922    45
2020-02-28 8461.830078    46
2020-03-02 8877.980469    47
2020-03-03 8594.490234    48
2020-03-04 8949.280273    49
2020-03-05 8671.660156    50

# Predictions for NASDAQ start here. -50 for each prediction count ahead.

2020-03-06 8677,729847    51
2020-03-06 8682,548889    52
2020-03-06 8686,256142    53
2020-03-06 8688,972807    54
2020-03-06 8690,804947    55
2020-03-06 8691,845610    56
2020-03-06 8692,176621    57
2020-03-06 8691,870105    58
2020-03-06 8690,989777    59
2020-03-06 8689,592046    60
Visit the aforementioned
GitHub link to get the code and some more information, but the threshold for using the tool is quite high. My apologies. :)
Calculate the Trend for the Dow Jones Index
And here's 30 samples back and 10 predictions ahead for the Dow Jones index as of today.
PS C:\temp> Get-SnP500Trend -FilePath .\^DJI.csv -SamplesBackCount 30 -PredictionsAheadCount 10 |
    select -Last 30

Date       Rate         Count
----       ----         -----
2020-02-06 29379.769531    11
2020-02-07 29102.509766    12
2020-02-10 29276.820313    13
2020-02-11 29276.339844    14
2020-02-12 29551.419922    15
2020-02-13 29423.310547    16
2020-02-14 29398.080078    17
2020-02-18 29232.189453    18
2020-02-19 29348.029297    19
2020-02-20 29219.980469    20
2020-02-21 28992.410156    21
2020-02-24 27960.800781    22
2020-02-25 27081.359375    23
2020-02-26 26957.589844    24
2020-02-27 25766.640625    25
2020-02-28 25409.359375    26
2020-03-02 26703.320313    27
2020-03-03 25917.410156    28
2020-03-04 27090.859375    29
2020-03-05 26121.279297    30

# Predictions ahead start here (-30 for each prediction count ahead):

2020-03-06 26024,340165    31
2020-03-06 25922,731828    32
2020-03-06 25817,276702    33
2020-03-06 25708,633062    34
2020-03-06 25597,331434    35
2020-03-06 25483,802158    36
2020-03-06 25368,396441    37
2020-03-06 25251,402555    38
2020-03-06 25133,058403    39
2020-03-06 25013,561333    40
Where are we?
If you're wondering how the developments have been recently, and not so recently, then it's handy to use my "Get-PeriodicDevelopment" function.
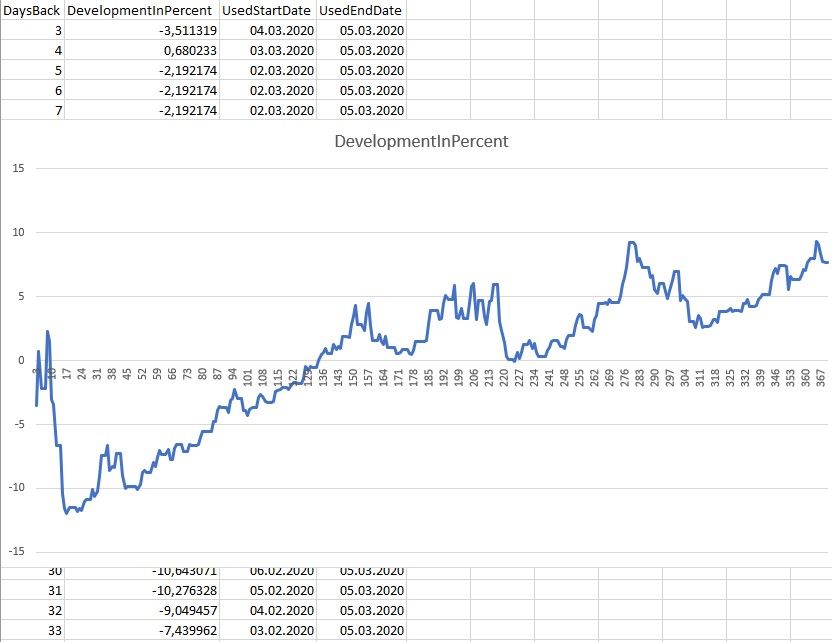
Here's an example where I analyse the SnP500 index and have a look a year back in time. If you look at the "370" entry, you can see that we're up 7 % since March 4, 2019. The corrections we're seeing are still relatively small historically, and circumstances are now indeed highly unusual.
PS C:\temp> . .\Get-PeriodicDevelopment.ps1
3..370 | where { $_ % 5 -eq 0 } | foreach {
    $Development = Get-PeriodicDevelopment -FilePath C:\temp\^GSPC.csv -StartDate (Get-Date).AddDays(-1 * $_) -EndDate (get-date).AddDays(-2)
    [PSCustomObject] @{
        DaysBack = $_
        DevelopmentInPercent = [Math]::Round($Development.PercentDevelopment, 6)
        UsedStartDate = $Development.UsedStartDate.ToString('yyyy\-MM\-dd')
        UsedEndDate = $Development.UsedEndDate.ToString('yyyy\-MM\-dd')
    }
} | ft

DaysBack DevelopmentInPercent UsedStartDate UsedEndDate
-------- -------------------- ------------- -----------
       5            -2,192174 2020-03-02    2020-03-05
      10            -3,057268 2020-02-26    2020-03-05
      15           -10,377523 2020-02-21    2020-03-05
      20           -11,453604 2020-02-18    2020-03-05
      25           -11,038912 2020-02-11    2020-03-05
      30           -10,643071 2020-02-06    2020-03-05
      35            -7,439962 2020-02-03    2020-03-05
      40            -7,265023 2020-01-27    2020-03-05
      45            -9,848412 2020-01-22    2020-03-05
      50           -10,108672 2020-01-17    2020-03-05
      55            -8,736613 2020-01-13    2020-03-05
      60            -7,051727 2020-01-07    2020-03-05
      65            -7,735278 2020-01-02    2020-03-05
      70            -6,526257 2019-12-30    2020-03-05
      75            -6,616205 2019-12-23    2020-03-05
      80            -5,529209 2019-12-18    2020-03-05
      85            -4,790443 2019-12-13    2020-03-05
      90            -3,704439 2019-12-09    2020-03-05
      95            -2,290390 2019-12-03    2020-03-05
     100            -3,870449 2019-11-29    2020-03-05
     105            -3,627716 2019-11-25    2020-03-05
     110            -3,243784 2019-11-18    2020-03-05
     115            -2,318171 2019-11-13    2020-03-05
     120            -2,286426 2019-11-08    2020-03-05
     125            -1,796665 2019-11-04    2020-03-05
     130            -0,428248 2019-10-29    2020-03-05
     135             0,451395 2019-10-24    2020-03-05
     140             0,569455 2019-10-21    2020-03-05
     145             1,911084 2019-10-14    2020-03-05
     150             3,457081 2019-10-09    2020-03-05
     155             2,378683 2019-10-04    2020-03-05
     160             1,560876 2019-09-30    2020-03-05
     165             1,896196 2019-09-24    2020-03-05
     170             0,567138 2019-09-19    2020-03-05
     175             0,859143 2019-09-16    2020-03-05
     180             1,504991 2019-09-09    2020-03-05
     185             2,849260 2019-09-04    2020-03-05
     190             3,223608 2019-08-30    2020-03-05
     195             4,813590 2019-08-26    2020-03-05
     200             4,081759 2019-08-20    2020-03-05
     205             5,831460 2019-08-15    2020-03-05
     210             4,670727 2019-08-12    2020-03-05
     215             5,926042 2019-08-05    2020-03-05
     220             1,440507 2019-07-31    2020-03-05
     225            -0,063499 2019-07-26    2020-03-05
     230             1,286729 2019-07-22    2020-03-05
     235             0,658079 2019-07-16    2020-03-05
     240             0,794660 2019-07-11    2020-03-05
     245             1,587002 2019-07-08    2020-03-05
     250             1,971265 2019-07-01    2020-03-05
     255             3,642927 2019-06-26    2020-03-05
     260             2,429942 2019-06-21    2020-03-05
     265             4,440234 2019-06-17    2020-03-05
     270             4,570857 2019-06-11    2020-03-05
     275             5,967379 2019-06-06    2020-03-05
     280             9,242577 2019-06-03    2020-03-05
     285             7,326536 2019-05-28    2020-03-05
     290             5,544750 2019-05-22    2020-03-05
     295             5,436944 2019-05-17    2020-03-05
     300             7,013030 2019-05-13    2020-03-05
     305             4,626080 2019-05-07    2020-03-05
     310             3,519247 2019-05-02    2020-03-05
     315             2,675645 2019-04-29    2020-03-05
     320             3,835062 2019-04-22    2020-03-05
     325             4,083745 2019-04-17    2020-03-05
     330             3,853583 2019-04-12    2020-03-05
     335             4,238507 2019-04-08    2020-03-05
     340             5,181980 2019-04-02    2020-03-05
     345             6,894978 2019-03-28    2020-03-05
     350             7,459799 2019-03-25    2020-03-05
     355             6,316263 2019-03-18    2020-03-05
     360             7,044453 2019-03-13    2020-03-05
     365             9,288209 2019-03-08    2020-03-05
     370             7,643336 2019-03-04    2020-03-05
Volatility in the NASDAQ Index is Higher
If we run the same example code against the NASDAQ index, we see the growth is bigger, at 17 % compared to 370 days back and the closest stock market day match to that day, March 4, 2019.
This uses the function Get-PeriodicDevelopment which I "dot-source" first to load/import it in the current session. Hold down shift when you press enter to spread a command over multiple lines...
PS C:\temp> . .\Get-PeriodicDevelopment.ps1
3..370 | where { $_ % 5 -eq 0 } | foreach {
    $Development = Get-PeriodicDevelopment -FilePath c:\temp\^NDX.csv -StartDate (Get-Date).AddDays(-1 * $_) -EndDate (get-date).AddDays(-2)
    [PSCustomObject] @{
        DaysBack = $_
        DevelopmentInPercent = [Math]::Round($Development.PercentDevelopment, 6)
        UsedStartDate = $Development.UsedStartDate.ToString('yyyy\-MM\-dd')
        UsedEndDate = $Development.UsedEndDate.ToString('yyyy\-MM\-dd')
    }
} | ft

DaysBack DevelopmentInPercent UsedStartDate UsedEndDate
-------- -------------------- ------------- -----------
       5            -2,379248 2020-03-02    2020-03-05
      10            -2,330576 2020-02-26    2020-03-05
      15            -8,937507 2020-02-21    2020-03-05
      20           -11,049091 2020-02-18    2020-03-05
      25            -9,758226 2020-02-11    2020-03-05
      30            -8,928622 2020-02-06    2020-03-05
      35            -5,242022 2020-02-03    2020-03-05
      40            -3,234900 2020-01-27    2020-03-05
      45            -5,961026 2020-01-22    2020-03-05
      50            -5,789783 2020-01-17    2020-03-05
      55            -4,601082 2020-01-13    2020-03-05
      60            -2,015647 2020-01-07    2020-03-05
      65            -2,312816 2020-01-02    2020-03-05
      70            -0,439020 2019-12-30    2020-03-05
      75            -0,280795 2019-12-23    2020-03-05
      80             1,049857 2019-12-18    2020-03-05
      85             2,121280 2019-12-13    2020-03-05
      90             3,562408 2019-12-09    2020-03-05
      95             4,807844 2019-12-03    2020-03-05
     100             3,090302 2019-11-29    2020-03-05
     105             3,456437 2019-11-25    2020-03-05
     110             3,957485 2019-11-18    2020-03-05
     115             4,749386 2019-11-13    2020-03-05
     120             4,794590 2019-11-08    2020-03-05
     125             5,316168 2019-11-04    2020-03-05
     130             7,197588 2019-10-29    2020-03-05
     135             8,129239 2019-10-24    2020-03-05
     140             8,433565 2019-10-21    2020-03-05
     145             9,563683 2019-10-14    2020-03-05
     150            11,314216 2019-10-09    2020-03-05
     155            10,581135 2019-10-04    2020-03-05
     160            10,634757 2019-09-30    2020-03-05
     165            11,089227 2019-09-24    2020-03-05
     170             8,878001 2019-09-19    2020-03-05
     175             9,447441 2019-09-16    2020-03-05
     180             9,678196 2019-09-09    2020-03-05
     185            10,983020 2019-09-04    2020-03-05
     190            11,308794 2019-08-30    2020-03-05
     195            12,646254 2019-08-26    2020-03-05
     200            11,614730 2019-08-20    2020-03-05
     205            13,685615 2019-08-15    2020-03-05
     210            12,800086 2019-08-12    2020-03-05
     215            14,483619 2019-08-05    2020-03-05
     220             9,489306 2019-07-31    2020-03-05
     225             7,549996 2019-07-26    2020-03-05
     230             8,839600 2019-07-22    2020-03-05
     235             8,586361 2019-07-16    2020-03-05
     240             8,935779 2019-07-11    2020-03-05
     245            10,215692 2019-07-08    2020-03-05
     250            10,419228 2019-07-01    2020-03-05
     255            12,046256 2019-06-26    2020-03-05
     260            10,873124 2019-06-21    2020-03-05
     265            13,205547 2019-06-17    2020-03-05
     270            13,351654 2019-06-11    2020-03-05
     275            16,095303 2019-06-06    2020-03-05
     280            19,530749 2019-06-03    2020-03-05
     285            16,067053 2019-05-28    2020-03-05
     290            14,426303 2019-05-22    2020-03-05
     295            13,468932 2019-05-17    2020-03-05
     300            15,539473 2019-05-13    2020-03-05
     305            11,895188 2019-05-07    2020-03-05
     310            10,927551 2019-05-02    2020-03-05
     315             9,601623 2019-04-29    2020-03-05
     320            11,049440 2019-04-22    2020-03-05
     325            11,427338 2019-04-17    2020-03-05
     330            12,033570 2019-04-12    2020-03-05
     335            12,361185 2019-04-08    2020-03-05
     340            13,515521 2019-04-02    2020-03-05
     345            15,581675 2019-03-28    2020-03-05
     350            15,622155 2019-03-25    2020-03-05
     355            15,514681 2019-03-18    2020-03-05
     360            16,313833 2019-03-13    2020-03-05
     365            19,096346 2019-03-08    2020-03-05
     370            17,537934 2019-03-04    2020-03-05
Graph of Percent-wise Development of the SnP500 Index from Back in Time to Today
We need a graph or it's no fun. This basically shows the down trend is recent... This is the SnP500 Index again.
 Powershell
Windows
Finance
Finans
Fintech
SnP500
NASDAQ
DowJones
Math
Powershell
Windows
Finance
Finans
Fintech
SnP500
NASDAQ
DowJones
Math
Blog articles in alphabetical order