
Jump to page sections
Static and Passive Mutual Fund Portfolio
Have you ever wondered what would happen if you could travel 2-3 years back in time and invest in some passive index funds? In this blog post I describe a, for the last two years, (almost) "static" portfolio, consisting of mutual index funds with low costs (0.3%-0.4%, no buy/sell costs). The investments were distributed as even shares of 500 NOK per fund in six funds. The funds are index funds for emerging markets, Denmark, Finland, global, Norway and Sweden.
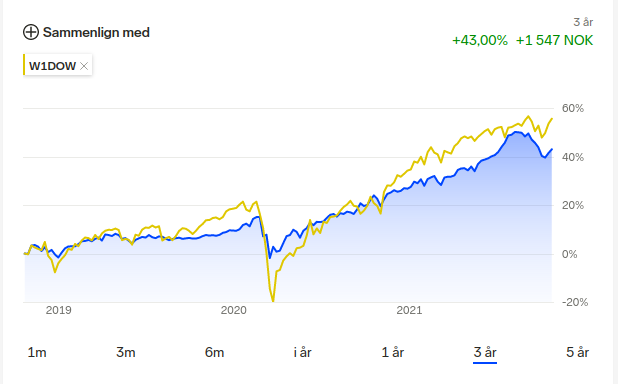
The net yield is 43 % since October 26, 2018. I'm writing this on the evening of October 27, 2021. To me it's somewhat interesting to see how I fared in this account where I did not actively manage my investments. I'm sad to say that the passive approach has beaten my managed approach in recent years, except for in my "casino portfolio stunt" where I struck luck and went up 70 % in an account over the course of a few months(!). Over 2.9 in Sharpe ratio for the last year. 0.5 Sharpe ratio for the last three years. Bumpy ride.
The Graph of the Last Three Years
The Minor Exceptions
On December 3, 2019, I bought the funds. There are a few exceptions. I bought KLP AksjeFremvoksende Markeder Indeks II on 2020-02-24. On February 10 and 11, 2021, I sold "DNB Teknologi" for 651 kroner and bought "Nordnet Indeksfond Global ESG NOK" for 500 kroner. I had made 151 kroner, 23 %, on DNB Teknologi, and kept that as cash. Now that I'm preparing to share this little nugget of information, I regret not staying truly static since that would have made describing it a lot easier, and the value of the information better.
The second exception is that when markets turned sour a few months ago, I decided to increase my market share for some healthy, contrarian fun, and bought some pseudorandom choices among mutual funds. These purchases were made between July 30 and September 10, 2021. These silly investments are currently down. This portfolio is public on "Shareville", something I used many years ago, a social finance networking website, so I figured I would let people scratch their heads about my choices. The choices are, in fact, close to random.
Here you can see the minor recent activity (negative value means buying, positive value selling). The impact on the portfolio's development
is mostly negligible still. It will impact more as time passes.
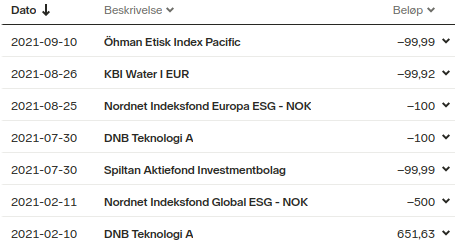
I used even amounts when buying. All the invested capital in each fund started as 500 kroner/NOK, except for the last 5 purchases in the screenshot, which were for 100 NOK each. It does not take a particularly sharp observer to see that the invested amount in this account is small, but you could in theory add 3 zeroes and get (almost) the same result, only on a larger scale (presumably these index funds and actively managed funds are large enough to not take notice of 5 million NOK much more than my 5000 NOK).
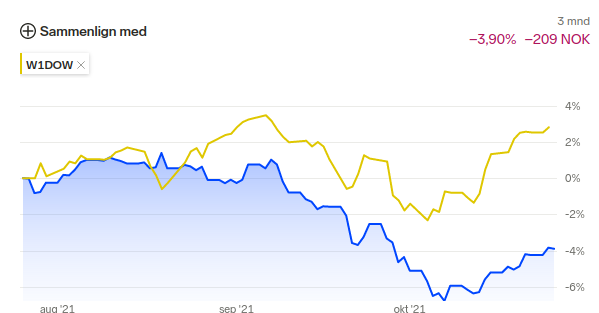
In the last 3 months, the portfolio is down 3.9 %.
If we look at the six largest shares of funds that all started out at 500 kroner each, we get a decent picture of where the best and worst development was for the last two years. These six funds:
- KLP AksjeFremvoksende Markeder Indeks II (since 2020-02-24)
- Nordnet Indeksfond Danmark B (since 2019-12-03)
- Nordnet Indeksfond Global ESG - NOK (since 2021-02-11)
- Nordnet Indeksfond Norge (since 2019-12-03)
- Nordnet Indeksirahasto Suomi (since 2019-12-03)
- Nordnet Indexfond Sverige (since 2019-12-03)
Development in NOK and percent, sorted by highest growth:
| Fund Name | Start Value (NOK) | Current Value (NOK) | Development in percent |
|---|---|---|---|
| Nordnet Indeksfond Danmark B (since 2019-12-03) | 500 | 905 | 80.91 |
| Nordnet Indeksfond Sverige (since 2019-12-03) | 500 | 761 | 52.25 |
| Nordnet Indeksirahasto Suomi (since 2019-12-03) | 500 | 696 | 39.31 |
| Nordnet Indeksfond Norge (since 2019-12-03) | 500 | 665 | 32.98 |
| Nordnet Indeksfond Global ESG - NOK (since 2021-02-11) | 500 | 567 | 13.46 |
| KLP AksjeFremvoksende Markeder II (since 2020-02-24) | 500 | 553 | 10.67 |
I notice the emerging markets fund is up less than the global fund (the latter heavy on technology), even though the emerging markets fund was bought a year earlier. The emerging markets have apparently not developed as much as the rest of the markets lately. Among the four nordic index funds that have a two year history in the account, the growth is between 33 % and 80 % for Norway and Denmark respectively. This is just from a random starting point in time, of course (December 2019).
Given this, there can be no doubt: All in emerging markets! To be serious, I actually don't have many thoughts about it, beyond "hindsight is 20-20". If I could go back I could have gotten on average 51.4 % from these four nordic funds in just two years. That is acceptable for a modest (I try, at least, with a few deviations) man such as myself.
I worry about tapering of QE and the debt spiral we're caught in. But I am remaining invested for better or worse at this point. Selling can be the instinct when prices go down. This has the downside that buying when prices go back up means that you have just sold cheaply and bought at a higher price. Unless you can somehow magically time it correctly, with the 2-5-day delay there is with mutual funds in play.
Given my penchant for mutual funds, you might think I fear volatility staying away from stocks (and currently even ETFs, but that could change at some point), but I have about 15-20 % of my investments in Bitcoin (mostly such a high percentage because of its success) where the volatility can be pretty wild. I am not an experienced crypto investor, I just bought some back in the days and am holding (a minor "hodler"!). If you wonder why Bitcoin has value, you can read my thoughts about it the other day here ("Bitcoin - and Why It Has Value")
Finance FinansBlog articles in alphabetical order
A
- A Look at the KLP AksjeNorden Index Mutual Fund
- A primitive hex version of the seq gnu utility, written in perl
- Accessing the Bing Search API v5 using PowerShell
- Accessing the Google Custom Search API using PowerShell
- Active directory password expiration notification
- Aksje-, fonds- og ETF-utbytterapportgenerator for Nordnet-transaksjonslogg
- Ascii art characters powershell script
- Automatically delete old IIS logs with PowerShell
C
- Calculate and enumerate subnets with PSipcalc
- Calculate the trend for financial products based on close rates
- Check for open TCP ports using PowerShell
- Check if an AD user exists with Get-ADUser
- Check when servers were last patched with Windows Update via COM or WSUS
- Compiling or packaging an executable from perl code on windows
- Convert between Windows and Unix epoch with Python and Perl
- Convert file encoding using linux and iconv
- Convert from most encodings to utf8 with powershell
- ConvertTo-Json for PowerShell version 2
- Create cryptographically secure and pseudorandom data with PowerShell
- Crypto is here - and it is not going away
- Crypto logo analysis ftw
D
G
- Get rid of Psychology in the Stock Markets
- Get Folder Size with PowerShell, Blazingly Fast
- Get Linux disk space report in PowerShell
- Get-Weather cmdlet for PowerShell, using the OpenWeatherMap API
- Get-wmiobject wrapper
- Getting computer information using powershell
- Getting computer models in a domain using Powershell
- Getting computer names from AD using Powershell
- Getting usernames from active directory with powershell
- Gnu seq on steroids with hex support and descending ranges
- Gullpriser hos Gullbanken mot spotprisen til gull
H
- Have PowerShell trigger an action when CPU or memory usage reaches certain values
- Historical view of the SnP 500 Index since 1927, when corona is rampant in mid-March 2020
- How Many Bitcoins (BTC) Are Lost
- How many people own 1 full BTC
- How to check perl module version
- How to list all AD computer object properties
- Hva det innebærer at særkravet for lån til sekundærbolig bortfaller
I
L
M
P
- Parse openssl certificate date output into .NET DateTime objects
- Parse PsLoggedOn.exe Output with PowerShell
- Parse schtasks.exe Output with PowerShell
- Perl on windows
- Port scan subnets with PSnmap for PowerShell
- PowerShell Relative Strength Index (RSI) Calculator
- PowerShell .NET regex to validate IPv6 address (RFC-compliant)
- PowerShell benchmarking module built around Measure-Command
- Powershell change the wmi timeout value
- PowerShell check if file exists
- Powershell check if folder exists
- PowerShell Cmdlet for Splitting an Array
- PowerShell Executables File System Locations
- PowerShell foreach loops and ForEach-Object
- PowerShell Get-MountPointData Cmdlet
- PowerShell Java Auto-Update Script
- Powershell multi-line comments
- Powershell prompt for password convert securestring to plain text
- Powershell psexec wrapper
- PowerShell regex to accurately match IPv4 address (0-255 only)
- Powershell regular expressions
- Powershell split operator
- Powershell vs perl at text processing
- PS2CMD - embed PowerShell code in a batch file
R
- Recursively Remove Empty Folders, using PowerShell
- Remote control mom via PowerShell and TeamViewer
- Remove empty elements from an array in PowerShell
- Remove first or last n characters from a string in PowerShell
- Rename unix utility - windows port
- Renaming files using PowerShell
- Running perl one-liners and scripts from powershell
S
- Sammenlign gullpriser og sølvpriser hos norske forhandlere av edelmetall
- Self-contained batch file with perl code
- Silver - The Underrated Investment
- Simple Morningstar Fund Report Script
- Sølv - den undervurderte investeringen
- Sort a list of computers by domain first and then name, using PowerShell
- Sort strings with numbers more humanely in PowerShell
- Sorting in ascending and descending order simultaneously in PowerShell
- Spar en slant med en optimalisert kredittkortportefølje
- Spre finansiell risiko på en skattesmart måte med flere Aksjesparekontoer
- SSH from PowerShell using the SSH.NET library
- SSH-Sessions Add-on with SCP SFTP Support
- Static Mutual Fund Portfolio the Last 2 Years Up 43 Percent
- STOXR - Currency Conversion Software - Open Exchange Rates API